
Building an Interactive Dashboard in Python
What I Learned: How to Build an Interactive Dashboard with Plotly Dash
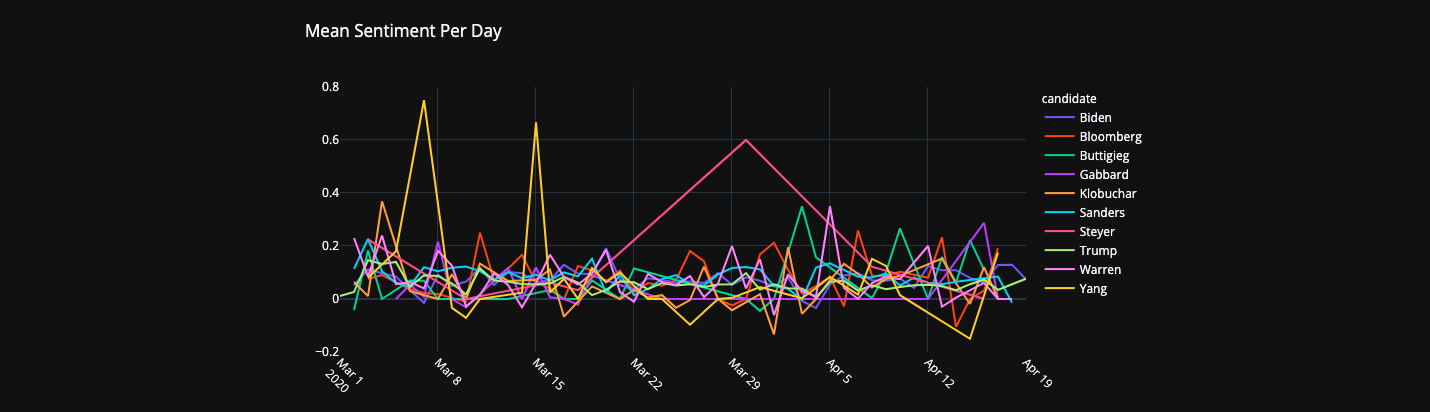
Throughout my final semester of my Master’s program, I’ve been working on a large-scale web scraping and text analysis project about monitoring media coverage of the 2020 Presidential Primary Election. As part of our final project, I created my first interactive dashboard with Plotly Dash.
The learning curve on this one was a bit steep for someone with no HTML/CSS experience (outside of customizing my MySpace page in the early 2000s), but once I got the hang of it putting this together was a lot of fun.
To learn more about the project, we also wrote up our findings in this Medium article.